Browser Developer Tools
Browser Consoles
The web browsers Firefox and Google Chrome both include a browser console tool which can help you create web pages.
If you're not using either of these browsers you may want to download one (they're both free) and use it for some of the exercises in this workshop.
In either browser, you can right-click any element on your page and choose "Inspect Element" to show it in the console. It's called the "Inspector" tab of the "Web Console" in Firefox and the "Elements" tab of the "Developer Tools" in Chrome, but they're both basically the same. This gives you a display of how the browser sees your page.
Try it with the page you've created so far, right-click something on your page and choose "Inspect Element":
The console that pops should look like this (this is FireFox, Chrome is different but similar):
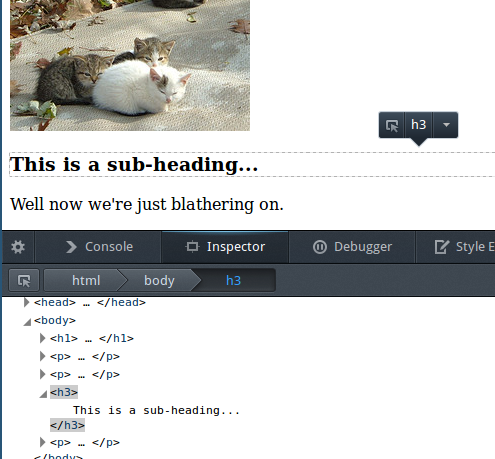
You can also click the little triangle arrows next to elements in the web console to look inside the structure of the HTML page, and click on other HTML elements to see them highlighted in the browser view.
Click around the HTML elements in the console to get a look at how the browser processes the HTML page you created. Don't be afraid to explore. The console has a lot of features so don't worry if not everything makes sense.
When you're done, you can close the console by clicking the "X" on the far-right end.
More information on working with the console can be found in the Firefox documentation and also the Chrome documentation.